Data Summaries, Figure 1 Federal Debt -- History”
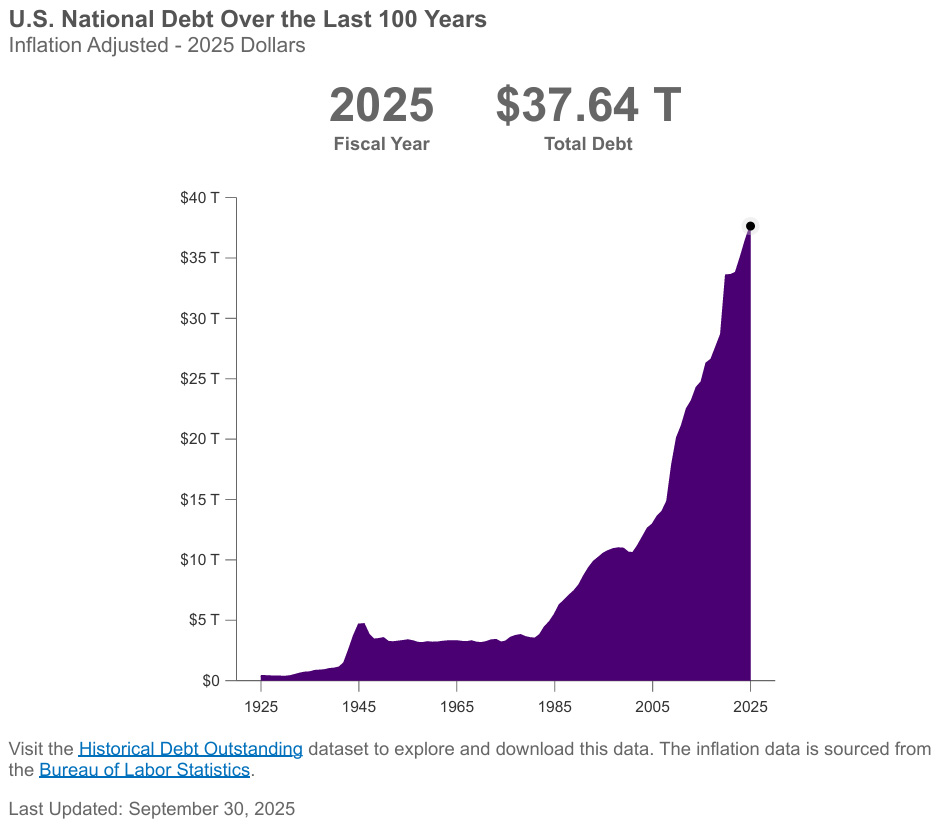
Following is a graph (Figure 1) showing how the national debt has grown in the 100 years between 1925 and 2025. The interactive source of Figure 1 that displays the size of the debt at any included federal fiscal year can be found by going to Understanding the National Debt | U.S. Treasury Fiscal Data and then scrolling down to the first graph. Figure 1 includes the great depression of the 1930’s, World War II (the first small peak at about 1946), and the exponential growth of the national debt since about 1980. It is important, however, to keep in mind that this representation of the debt is not corrected for GDP growth.
|